Power BI dashboard
Build a Power BI dashboard, or the same dashboard without Power BI
A Power BI dashboard on your accounting or CRM data needs a connector, a data model and licences. DigiData supplies the data to Power BI through OData. And if you want the dashboard without that groundwork, the AI agent builds it directly in DigiData.
14 days free · no start-up costs · cancel monthly
What is a Power BI dashboard?
A Power BI dashboard is an interactive overview of business figures that you build in Microsoft Power BI. Strictly speaking, a report in Power BI is a set of pages with visuals, and a dashboard is a single canvas of tiles pinned from reports. In practice most people use Power BI dashboard to mean the report in which they look at their numbers every day.
What you get
Two routes on the same data
You do not have to choose. DigiData supports both.
Feed Power BI through OData
DigiData makes your business data available as an OData feed. Power BI and Excel read it directly, with scheduled refresh.
A dashboard without Power BI
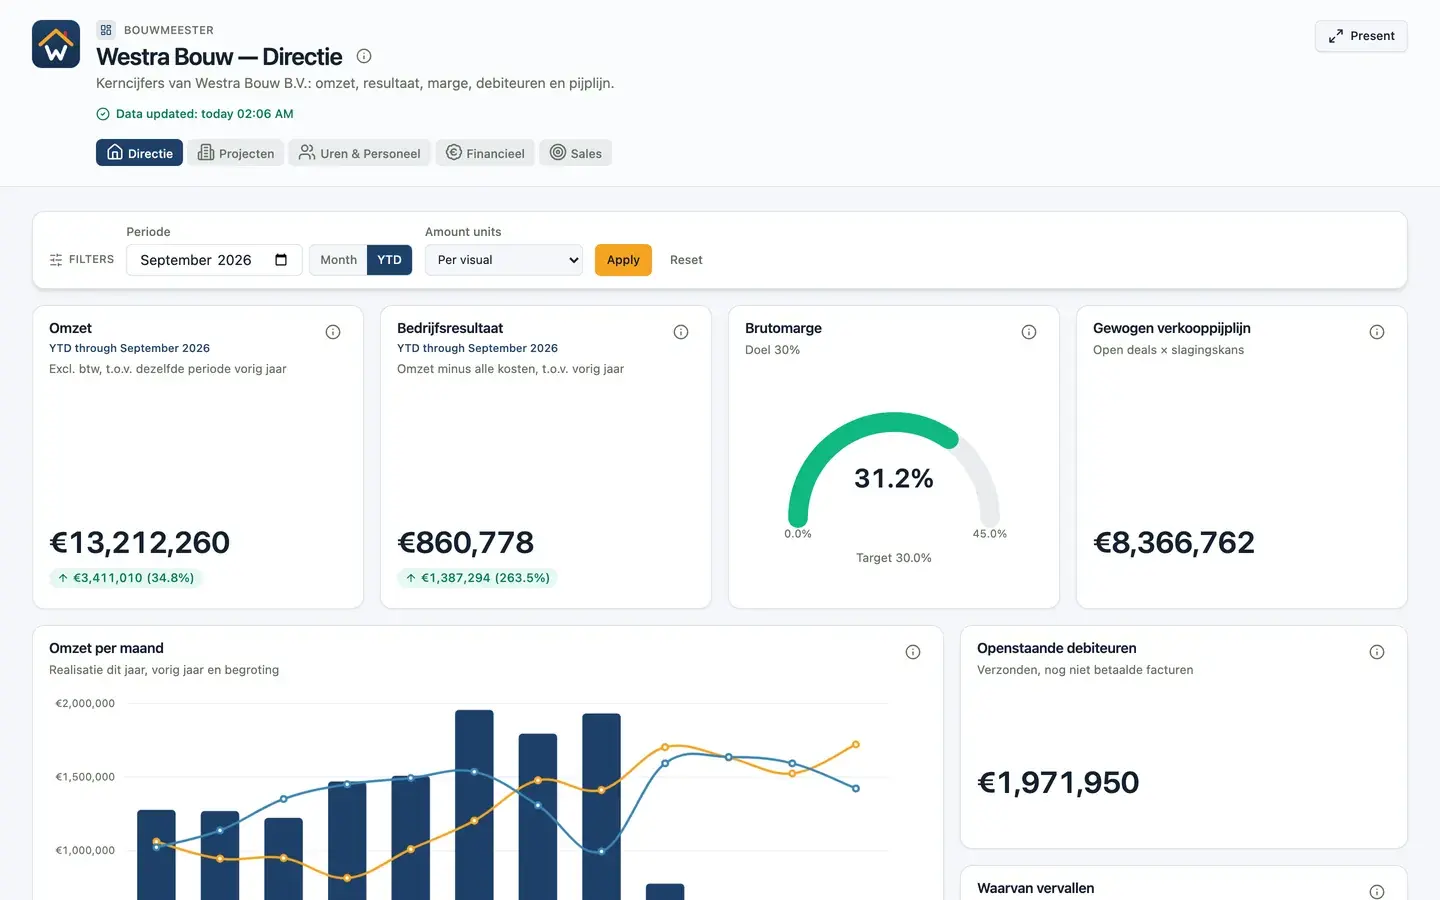
Describe what you want to see and the AI agent builds the dashboard in DigiData. No Desktop, data model or DAX needed.
Works in any browser
You build and view DigiData dashboards in the browser, including on a Mac.
Share without per-viewer licences
Share with the whole team or through a read-only link. You pay for the platform and per connector, not per user.
Presentation mode
Put a dashboard on a TV screen or in the meeting. It steps through the pages by itself and repeats per project or team.
Choose per report
Keep complex models in Power BI and put new management dashboards in DigiData. Both run on the same data.
How it works
How to build the dashboard in DigiData
The same data, without Desktop, a data model and DAX.
Connect your sources
Connect Exact Online, Twinfield or Simplicate, for example. DigiData syncs the data automatically, from hourly to weekly.
Agree the definitions
Decide what revenue, margin and other key figures mean, as you would otherwise do in measures. Dashboards, the AI agent and email reports then all calculate with the same measurements.
Describe your dashboard
Ask for the overview you would build in Power BI. The AI agent builds the first version and you adjust widgets, filters and colours in the visual editor.
Requirements
What do you need for a Power BI dashboard?
Power BI is powerful, but the dashboard itself is the last part of the work.
Open the live example- Power BI Desktop to build the report. It runs on Windows only
- A connector or OData feed to your accounting, CRM or project software
- A data model with relationships between the tables
- Measures in DAX for revenue, margin and other key figures
- Paid licences to publish and share with colleagues
- A scheduled refresh, so the figures stay current
Our Power BI licensing guide explains which licence you need.
Comparison
Power BI dashboard or DigiData dashboard
Both show the same figures. The difference is in the work around them.
| Aspect | Power BI dashboard | DigiData dashboard |
|---|---|---|
| Building | In Power BI Desktop on Windows, with Power Query and DAX | In the browser. AI builds from your description, adjust in the visual editor |
| Data from accounting or CRM | Through a connector or OData feed, such as DigiData's | Connectors are part of the platform |
| Sharing | In most situations a paid licence per user | No cost per user. Private or through a read-only link |
| Presenting | Full-screen view | Presentation mode with auto-advance and one slide per filter value |
| AI | Depends on the chosen Microsoft environment and setup | AI agent builds dashboards and answers questions on the same definitions |
| Best choice for | Complex models, broad self-service BI and an existing Microsoft landscape | Management and operational dashboards without a BI specialist |
Power BI remains the better choice if your organisation already uses many DAX models, broad self-service BI or deep Microsoft-specific reporting.
More dashboards
All about building dashboards with AIFinancial dashboard
Result against budget, DSO and receivables on your accounting data.
KPI dashboard
The key figures you steer on, each with a target or comparison.
Management dashboard
Revenue, result, margin and pipeline in one overview for leadership.
Sales dashboard
Quarterly target, win rate, pipeline and funnel on your CRM data.
Project dashboard
Project margin, order book, hours and progress per project.
Custom dashboards
Let AI build the dashboard, or build the first set together with us.
Is a Power BI dashboard free?
Power BI Desktop is free to download and lets you build a report. To publish it and share it with colleagues you need paid licences in most situations. Our Power BI licensing article explains which licence fits which situation.
Can I build a Power BI dashboard on Exact Online?
Yes, but Exact Online does not have a built-in Power BI connector. The practical route is an OData feed, a standard that Power BI supports natively. DigiData provides that feed for Exact Online and other packages.
Does Power BI work on a Mac?
Power BI Desktop, which you use to build reports, is available for Windows only. On a Mac you can view published reports in the browser, but not build them in Desktop. DigiData dashboards are built and viewed entirely in the browser.
What is the difference between a Power BI dashboard and a report?
A report is a set of pages with visuals on one dataset. A dashboard is a single canvas of tiles that you pin from reports. Most people use the word dashboard for both.
Can I use Power BI and DigiData dashboards side by side?
Yes. The same synced data is available through OData for Power BI and Excel, and directly in DigiData dashboards. You can choose per report.
14 days free · no start-up costs
Curious what your dashboard looks like without Power BI?
We show it on your own data in a 20-minute demo.