Management dashboard
A management dashboard for leadership teams
One overview where leadership sees whether the year is on track: revenue, result, margin, receivables and the sales pipeline. DigiData combines accounting, projects and CRM, and puts the dashboard on the meeting-room screen in one click.
14 days free · no start-up costs · cancel monthly
What is a management dashboard?
A management dashboard is a compact overview of the information leadership steers on. It brings together figures from different systems, such as accounting, project administration, CRM and HR software, and shows each area against last year or budget. It replaces the monthly round of collecting numbers in Excel with an overview that stays current by itself.
What you get
Made for the management meeting
Less time collecting numbers, more time discussing them.
Every department in one overview
Combine accounting, projects, CRM and HR data. Each department gets its own page in the same report.
Always with a comparison
Every figure sits next to last year, the budget or a target. A revenue number alone says little; the difference does.
Present in one click
Start presentation mode in the meeting and step through with a keyboard or clicker. No export to slides.
Monthly report by email
Have the team receive a report automatically every month, or an alert as soon as a figure falls outside the agreed range.
Questions during the meeting
Ask in the dashboard chat why margin is falling. The AI agent answers on the same definitions as the charts.
Share with whoever needs it
Share privately with signed-in colleagues or through a read-only link with board members or advisers.
How it works
How to build a management dashboard
From separate exports to one overview that updates itself.
Connect your sources
Connect accounting, project software and CRM, for example Exact Online, Simplicate and Pipedrive. DigiData syncs the data automatically, from hourly to weekly.
Agree the definitions
Agree as a team what revenue, margin and order book mean exactly. Dashboards, the AI agent and email reports then all calculate with the same measurements.
Describe your dashboard
Ask, for example, for a leadership overview with revenue, result, margin and pipeline per month. The AI agent builds the first version and you adjust widgets, filters and colours in the visual editor.
Live example
What does the management team see here?
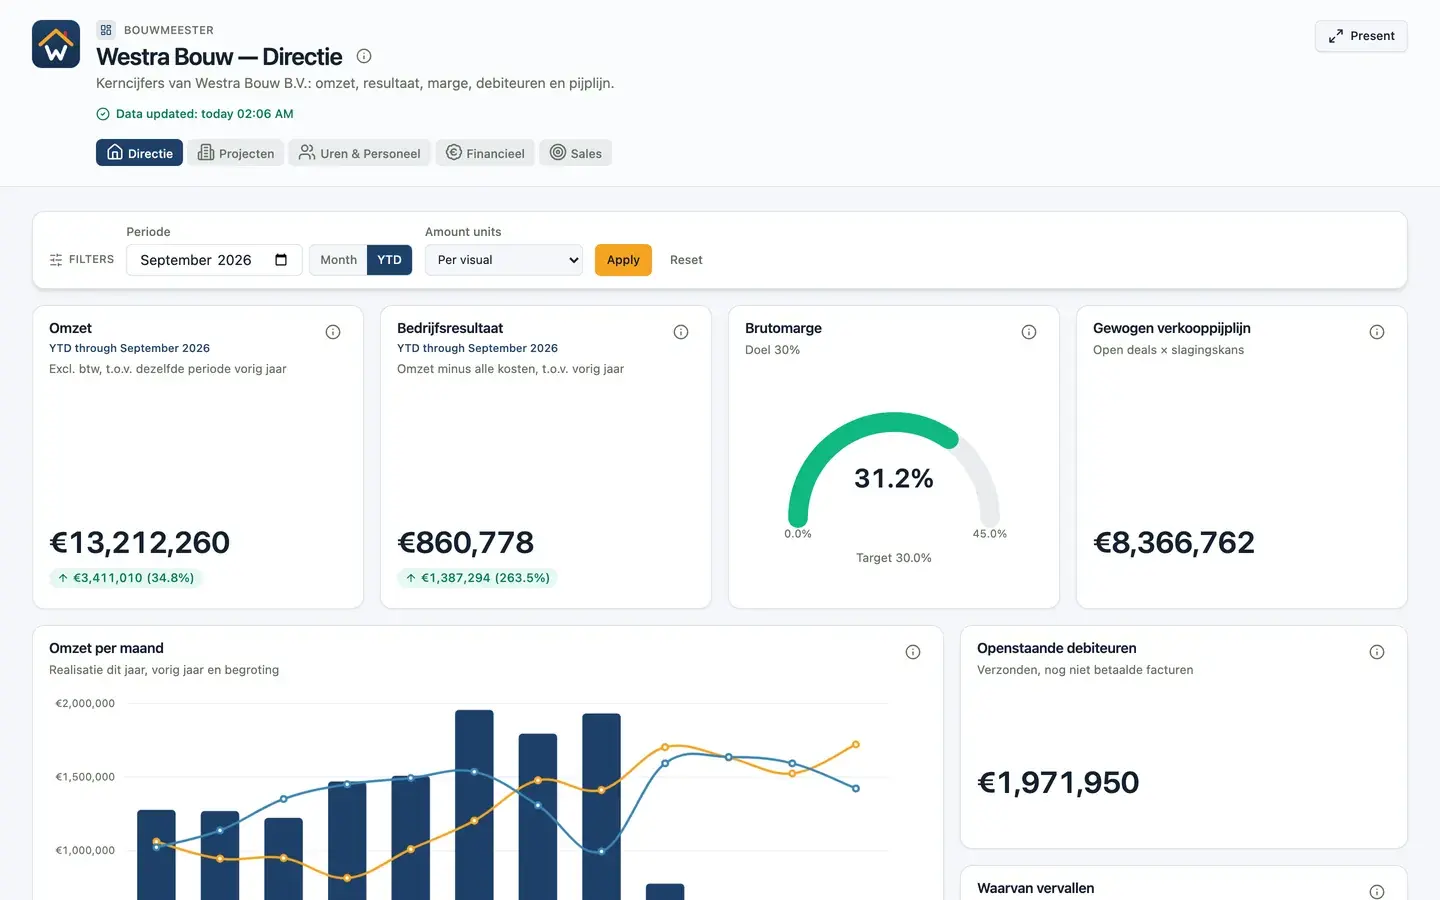
The leadership overview of the fictional Westra Bouw combines three sources. Open it and click through yourself.
Open the live example- Revenue and operating result this year against last year
- Gross margin against a 30% target
- Revenue per month next to last year and budget
- Open and overdue receivables
- Sales pipeline from the CRM
- Revenue per project category and cumulative result
Sources in the demo: accounting (Exact Online), project software (Exact Bouw) and CRM (Pipedrive).
More dashboards
All about building dashboards with AIFinancial dashboard
Result against budget, DSO and receivables on your accounting data.
KPI dashboard
The key figures you steer on, each with a target or comparison.
Sales dashboard
Quarterly target, win rate, pipeline and funnel on your CRM data.
Project dashboard
Project margin, order book, hours and progress per project.
Custom dashboards
Let AI build the dashboard, or build the first set together with us.
Power BI dashboard
What you need for a Power BI dashboard, and the alternative.
What goes on a management dashboard?
The figures leadership decides on: revenue and result against budget, gross margin, liquidity and receivables, order book or pipeline, and one or two key figures per department. Keep it to one screen and put the detail one click away.
How is it different from a management report?
A management report is a periodic document, often monthly, with commentary. A management dashboard is continuously current and interactive. In DigiData you use both on the same data: the dashboard for daily insight and a scheduled email report for the month-end.
Can I combine figures from several systems?
Yes. DigiData syncs the connected sources into one data layer. That lets you put revenue from accounting, hours from project software and deals from the CRM on a single dashboard.
Can we show the dashboard on a screen in the meeting?
Yes. Every dashboard has a presentation mode with presets for meetings and wall screens. Pages scale to fit the screen and you step through with a keyboard or presentation clicker.
14 days free · no start-up costs
The next management meeting with a dashboard?
We show in a demo how accounting, projects and CRM come together in one overview.