KPI dashboard
Build a KPI dashboard on your own business data
Put the figures you steer on in one screen, each with a target, budget or last year next to it. The AI agent builds the KPI dashboard on your connected accounting, CRM and project software, and keeps the definitions the same for everyone.
14 days free · no start-up costs · cancel monthly
What is a KPI dashboard?
A KPI dashboard is one screen with the five to ten key figures a team or company steers on, such as revenue, gross margin, productivity or days sales outstanding. Each KPI sits next to a target, budget or previous period, so it is clear straight away whether things are on track. A good KPI dashboard pulls the numbers from the source systems automatically and lets you click through to the detail behind a deviation.
What you get
KPIs everyone reads the same way
A KPI is only useful once the calculation is fixed and the comparison is shown.
Every KPI has a target
Put a target, budget or last year next to the figure. A gauge or colour shows whether you are above or below it.
One definition per KPI
Agree what revenue, margin or active customer means. Dashboards, the AI agent and reports use the same measurement.
Click through to the cause
Go from a KPI to the customers, projects or invoices behind it with drilldowns and filters that drive every chart at once.
An alert when it deviates
Have an email sent as soon as a KPI drops below a threshold, or receive the overview in your inbox every Monday.
On a TV or in the meeting
Put the KPI dashboard in presentation mode on an office screen. It steps through the pages by itself.
Ask questions about your KPIs
Ask in the dashboard chat why a figure changed. The AI agent calculates with the same approved measurements.
How it works
How to build a KPI dashboard
Start with the decisions you want to make, not with a list of charts.
Connect your sources
Connect the systems your KPIs come from, such as Exact Online, Twinfield, Simplicate or Pipedrive. DigiData syncs the data automatically, from hourly to weekly.
Agree the definitions
Pick five to ten KPIs and set the calculation and target for each. Dashboards, the AI agent and email reports then all calculate with the same measurements.
Describe your dashboard
Ask, for example, for revenue, margin and DSO with a target and a comparison with last year. The AI agent builds the first version and you adjust widgets, filters and colours in the visual editor.
Live example
Which KPIs are on this dashboard?
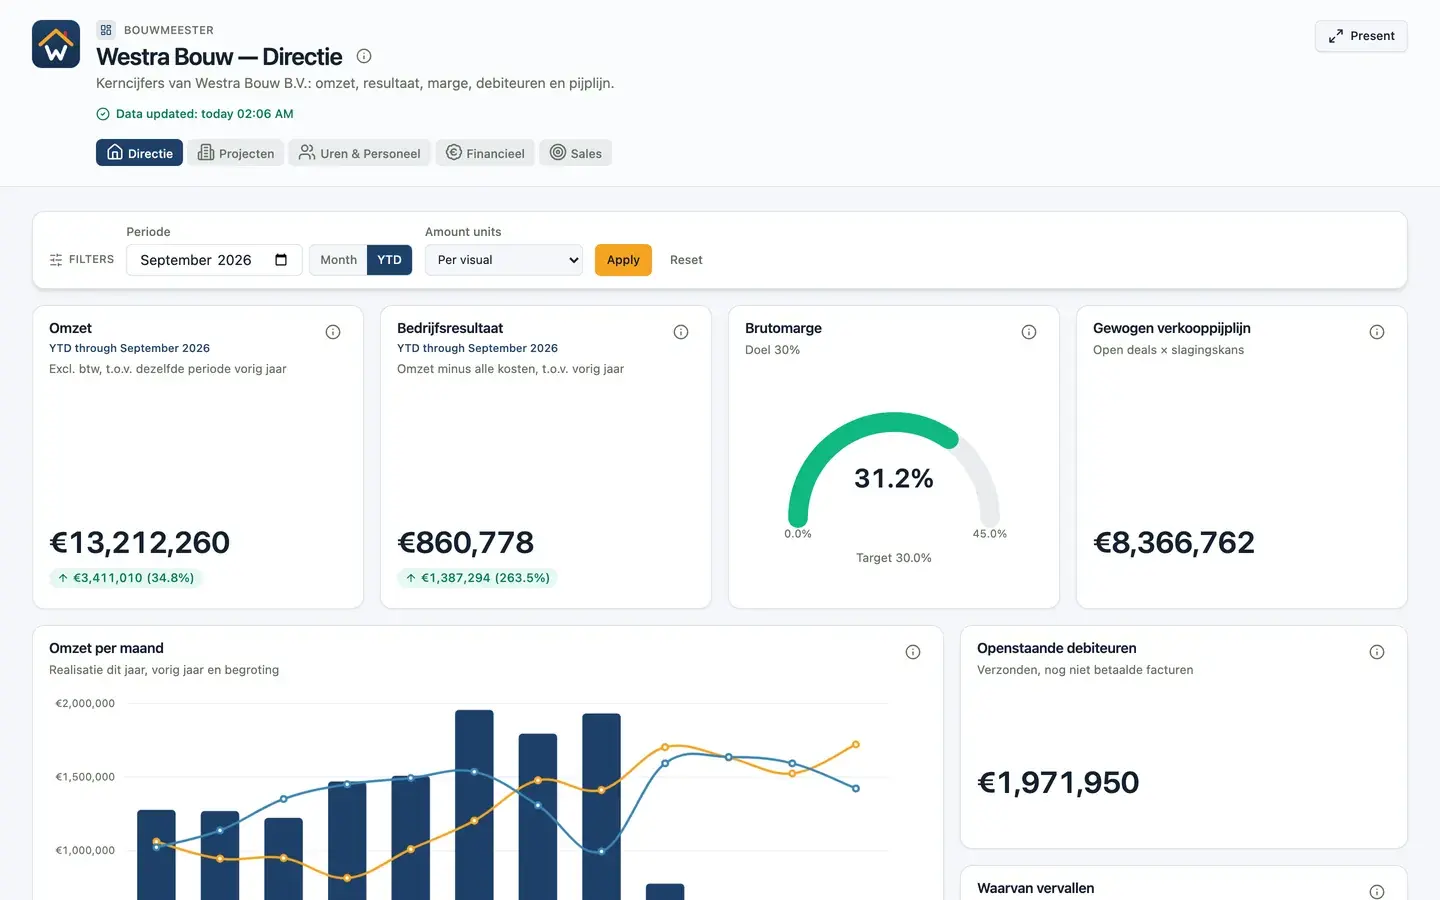
The leadership dashboard of the fictional Westra Bouw shows what KPIs with a comparison look like. Open it and click through yourself.
Open the live example- Revenue and operating result this year, with the difference from last year
- Gross margin as a gauge with a 30% target
- Revenue per month next to last year and budget
- Waterfall from revenue to operating result
- Open and overdue receivables
- Sales pipeline and revenue per project category
Sources in the demo: accounting, project software and CRM.
More dashboards
All about building dashboards with AIFinancial dashboard
Result against budget, DSO and receivables on your accounting data.
Management dashboard
Revenue, result, margin and pipeline in one overview for leadership.
Sales dashboard
Quarterly target, win rate, pipeline and funnel on your CRM data.
Project dashboard
Project margin, order book, hours and progress per project.
Custom dashboards
Let AI build the dashboard, or build the first set together with us.
Power BI dashboard
What you need for a Power BI dashboard, and the alternative.
Which KPIs should go on a dashboard?
Choose the figures you actually act on. For many small and mid-sized companies those are revenue, gross margin, operating result, days sales outstanding, order book and productivity. Our article with 12 KPI examples gives the formula, source and follow-up action for each.
How many KPIs belong on one dashboard?
Five to ten per audience works best. With more figures it becomes a report in which nobody can see what needs attention. Build one dashboard per role instead, for example leadership, finance and sales.
Can I build a KPI dashboard without Excel or Power BI?
Yes. In DigiData you describe which KPIs you want to see and the AI agent builds the dashboard on your connected data. You do not need formulas, a data model or a separate reporting tool.
Can I get an alert when a KPI drops below target?
Yes. With automations you set a threshold and receive an email as soon as a KPI crosses it. You can also schedule a fixed weekly overview.
14 days free · no start-up costs
Your own KPIs on one screen?
Tell us what you steer on. We show what it looks like on your own data in a demo.