Sales dashboard
A sales dashboard on your own CRM data
See whether the team will hit the quarterly target, how healthy the pipeline is and which follow-ups have stalled. DigiData builds the sales dashboard with AI on Pipedrive, HubSpot or Simplicate and combines it with invoiced revenue from your accounting system.
14 days free · no start-up costs · cancel monthly
What is a sales dashboard?
A sales dashboard is an overview of a team's sales performance: won revenue against target, the value and shape of the pipeline, the win rate and the follow-up on open deals. It pulls the data from the CRM and makes clear in one screen whether the target is within reach and where the pipeline is stuck.
What you get
From a CRM list to steering information
The same dashboard for the weekly meeting, the one-to-one and the office screen.
Target against actuals
Put the quarterly or annual target next to won revenue and see how much pipeline is needed to close the gap.
Filter by rep or pipeline
One dashboard for the whole team, with filters that narrow it to a rep, region or pipeline in one click.
Funnel and win rate
See at which stage deals drop out and why, with loss reasons and the origin of won orders.
Quote to invoice
Combine deals from the CRM with invoiced revenue from accounting, so sales and finance look at the same numbers.
On the office screen
Let the sales dashboard loop in presentation mode on a TV, showing today's position.
Weekly overview in your inbox
Schedule an email with the pipeline position on Monday morning, or an alert for overdue follow-ups.
How it works
How to build a sales dashboard
No report builder inside the CRM and no export to Excel.
Connect your sources
Connect your CRM, for example Pipedrive, HubSpot or Simplicate, and optionally your accounting system. DigiData syncs the data automatically, from hourly to weekly.
Agree the definitions
Decide what counts as a won deal, how the pipeline is weighted and which target applies. Dashboards, the AI agent and email reports then all calculate with the same measurements.
Describe your dashboard
Ask, for example, for won revenue against the quarterly target, the funnel and open deals per rep. The AI agent builds the first version and you adjust widgets, filters and colours in the visual editor.
Live example
What is on this sales dashboard?
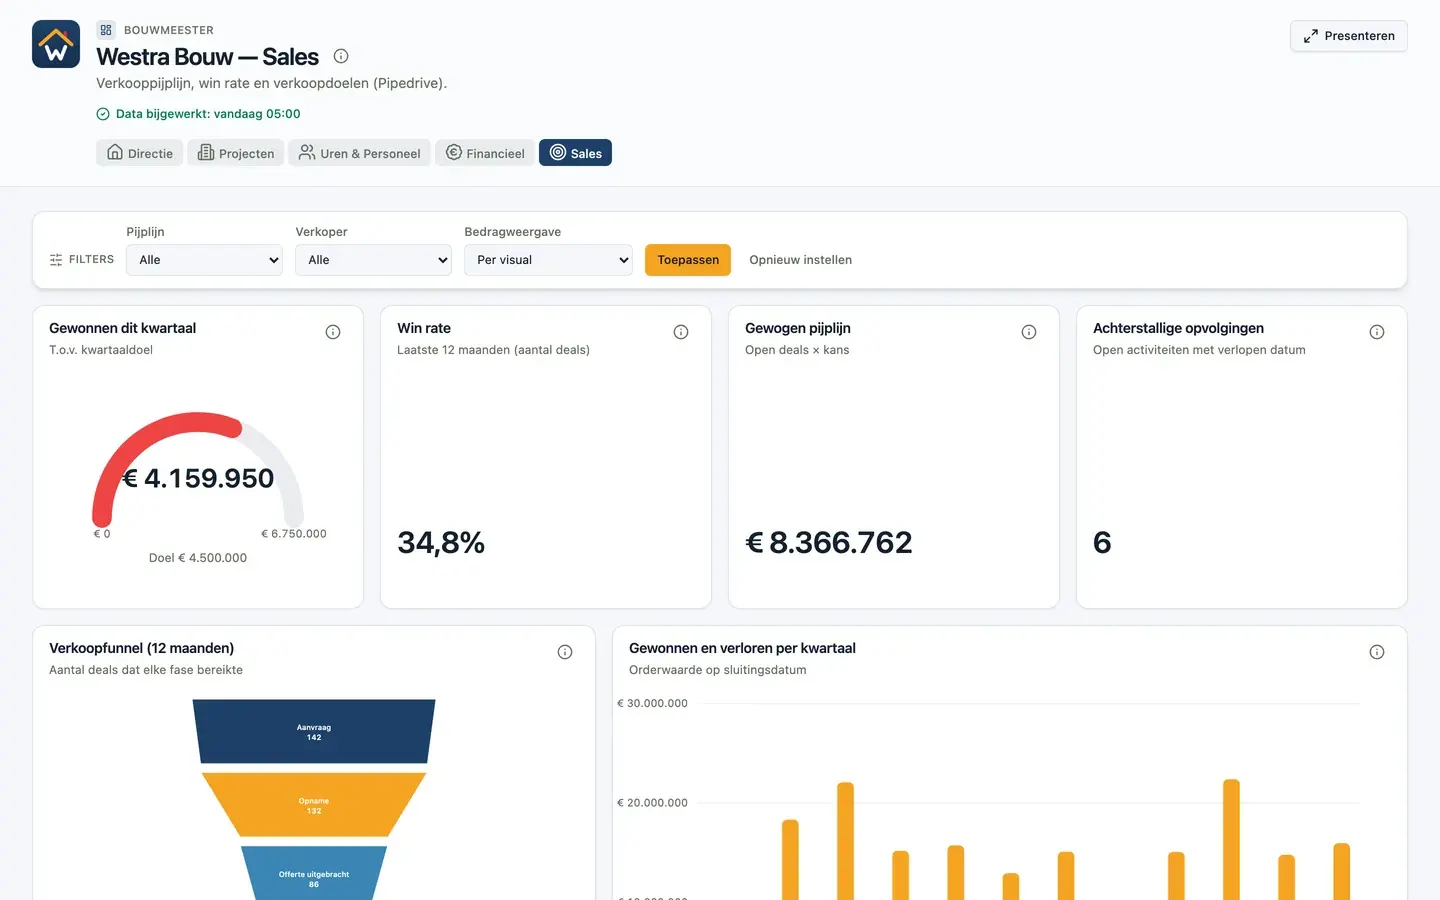
The sales dashboard of the fictional Westra Bouw runs on sample data shaped like Pipedrive. Open it and click through yourself.
Open the live example- Won revenue this quarter against the quarterly target
- Win rate over twelve months
- Weighted pipeline
- Overdue follow-ups
- Sales funnel and won against lost per quarter
- Loss reasons and the origin of won orders
Source in the demo: CRM data shaped like Pipedrive.
More dashboards
All about building dashboards with AIFinancial dashboard
Result against budget, DSO and receivables on your accounting data.
KPI dashboard
The key figures you steer on, each with a target or comparison.
Management dashboard
Revenue, result, margin and pipeline in one overview for leadership.
Project dashboard
Project margin, order book, hours and progress per project.
Custom dashboards
Let AI build the dashboard, or build the first set together with us.
Power BI dashboard
What you need for a Power BI dashboard, and the alternative.
Which KPIs belong on a sales dashboard?
Won revenue against target, weighted pipeline value, win rate, average deal size, sales cycle length and the number of overdue follow-ups. Add a funnel to see at which stage deals drop out.
Which CRM systems does the sales dashboard work with?
DigiData has connectors for Pipedrive, HubSpot and Simplicate, among others. The current list and the tables available per connector are on the integrations page.
Can I combine sales data with revenue from accounting?
Yes. Because DigiData puts all connected sources in one data layer, you can show CRM deals next to invoiced revenue from Exact Online or Twinfield, for example.
Can the sales dashboard run on a TV screen?
Yes. Presentation mode has a preset for wall screens, steps through the pages automatically and can loop indefinitely.
14 days free · no start-up costs
Your own pipeline in a dashboard?
We connect your CRM and show your own deals and targets in a demo.