Financial dashboard
A financial dashboard on your own accounting data
See result, margin, liquidity and open items in one financial dashboard that refreshes from Exact Online or Twinfield. You describe what you want to see, the AI agent builds it, and you click from any total down to the journal entry.
14 days free · no start-up costs · cancel monthly
What is a financial dashboard?
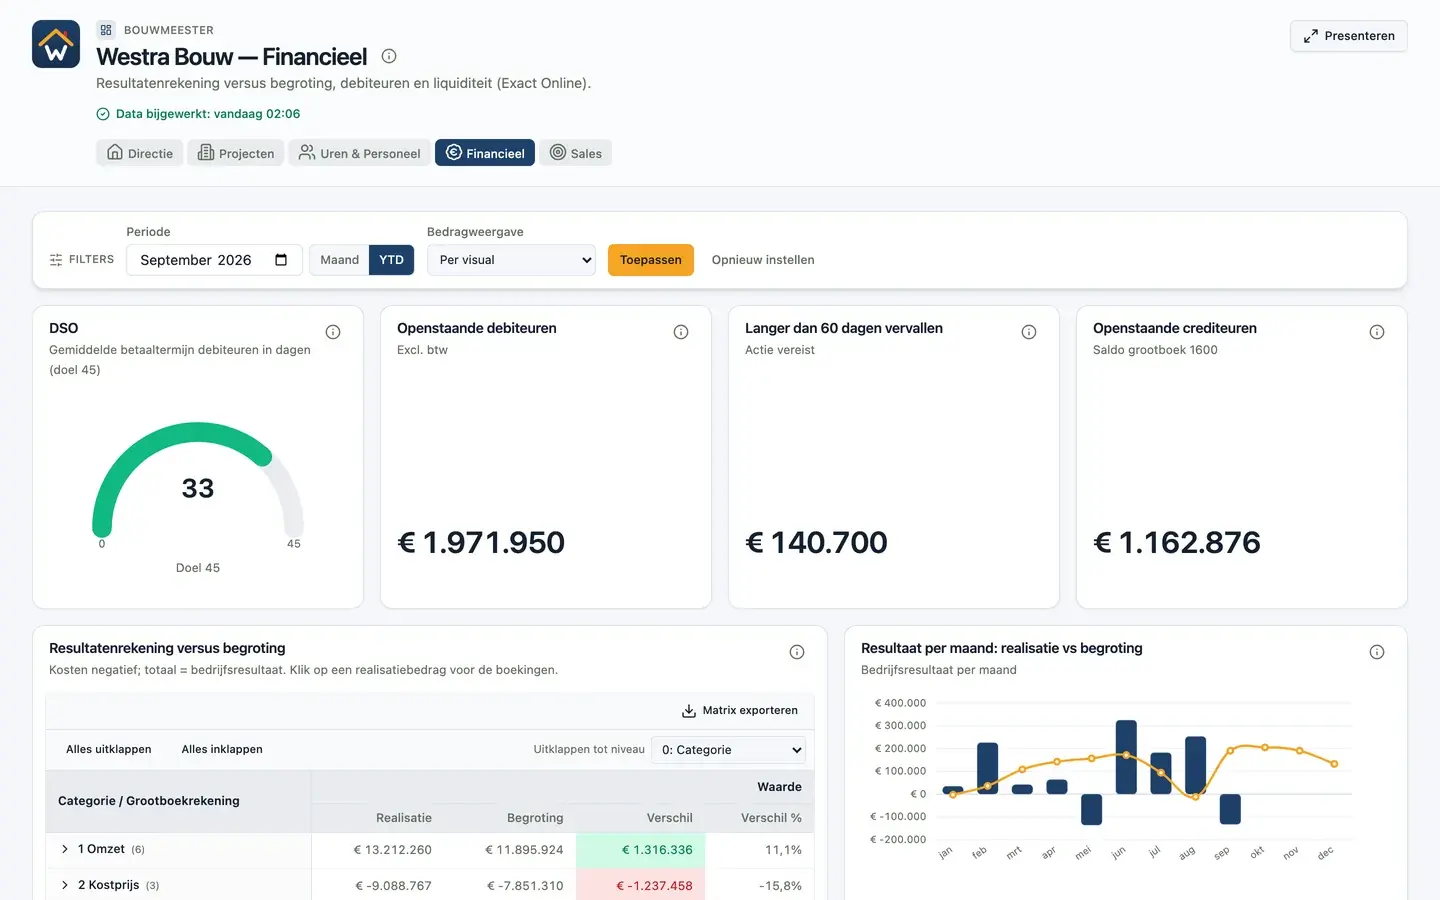
A financial dashboard is a visual overview of a company's key financial figures, such as revenue, result against budget, gross margin, liquidity and outstanding receivables. It pulls the numbers from the accounting system automatically and sets each figure next to a comparison. Leadership and finance see at a glance where things deviate and click through to the cause, without exporting to Excel.
What you get
From month-end close to daily insight
The parts that make a financial dashboard useful for finance and leadership.
Actuals against budget
Upload your budget as a CSV and set it next to the actuals from your accounting system, per month and per cost category.
Receivables and DSO
Track days sales outstanding, ageing per customer and overdue invoices, so you know who to call this week.
From total to journal entry
Click an amount in the income statement to see the ledger accounts and entries behind it. No separate export needed.
Multiple entities
Combine several Exact Online or Twinfield administrations in one dashboard and filter by company or office.
One definition of revenue and margin
Decide once which ledger accounts count. Every dashboard and every AI agent answer then uses the same calculation.
Share without per-viewer licences
Share the dashboard privately with colleagues or through a read-only link with your accountant. You do not pay per user.
How it works
How to build a financial dashboard
Three steps, with no Power BI model or formulas.
Connect your sources
Connect Exact Online, Twinfield or another accounting package. DigiData syncs the data automatically, from hourly to weekly.
Agree the definitions
Decide what revenue, gross margin and DSO mean in your books. Dashboards, the AI agent and email reports then all calculate with the same measurements.
Describe your dashboard
Ask, for example, for result against budget, DSO and your ten largest debtors. The AI agent builds the first version and you adjust widgets, filters and colours in the visual editor.
Live example
What is on this financial dashboard?
The example runs on fictional data from Westra Bouw, a construction company with 50 employees. Open it and click through yourself.
Open the live example- Days sales outstanding (DSO) against a 45-day target
- Open receivables, payables and items older than 60 days
- Income statement against budget, with click-through to the journal entry
- Result per month: actuals next to budget
- Receivables ageing per customer
- Open sales invoices with due dates
Source in the demo: accounting data shaped like Exact Online.
More dashboards
All about building dashboards with AIKPI dashboard
The key figures you steer on, each with a target or comparison.
Management dashboard
Revenue, result, margin and pipeline in one overview for leadership.
Sales dashboard
Quarterly target, win rate, pipeline and funnel on your CRM data.
Project dashboard
Project margin, order book, hours and progress per project.
Custom dashboards
Let AI build the dashboard, or build the first set together with us.
Power BI dashboard
What you need for a Power BI dashboard, and the alternative.
Which KPIs belong on a financial dashboard?
Start with revenue and result against budget, gross margin, days sales outstanding (DSO), overdue receivables, open payables and the cash position. Give every figure a comparison with last year, the budget or a target, so it is immediately clear whether action is needed.
Can I build a financial dashboard on Exact Online or Twinfield?
Yes. DigiData has connectors for Exact Online and Twinfield. After connecting, ledger accounts, transactions, receivables and payables are available and the AI agent can build a financial dashboard. The exact tables are listed on each integration page.
Can I show budget and actuals side by side?
Yes. A budget that still lives in a spreadsheet can be uploaded as a CSV. DigiData combines it with the actuals from your accounting system, so you see the difference per month and per category.
Do I need Power BI for a financial dashboard?
No. The dashboard runs in DigiData itself, in the browser. If you already use Power BI, the same synced data is also available there through OData.
How current are the numbers?
You set the sync frequency per connector, from hourly to weekly. The dashboard shows the most recently synced data and how fresh it is.
14 days free · no start-up costs
A financial dashboard like this on your own numbers?
We connect your accounting system and show your own data in a 20-minute demo.