AI dashboards built for you
Build an AI dashboard with your business data
DigiData creates interactive dashboards directly on your connected business data. Describe what you want to see, let AI build the first version and adjust figures, filters and visuals with ease. Then share the dashboard, ask the AI assistant questions or put it on a TV screen in presentation mode.
14 days free · no start-up costs · can be canceled monthly
What is an AI native dashboard?
An AI-native dashboard is an interactive dashboard that works with AI from the start. With DigiData, the AI agent uses the same synchronized data, relationships and approved metrics as the graphs. You can ask the agent to create a dashboard, add a KPI, or change a filter. With optional dashboard chat you can then ask follow-up questions about the figures you see. The AI layer is therefore part of the construction and use process, not as a separate addition afterwards.
What you get
Everything for a usable custom dashboard
From a quick KPI overview to an interactive dashboard for daily use.
Building with AI
Describe the dashboard you need. The DigiData AI agent can build dashboards, widgets and filters and later adjust them based on your feedback.
17 types of visualizations
Use KPI charts, tables, line and bar graphs, funnels, waterfalls, maps, matrices and more for management and operational reporting.
Interactive analysis
Add filters, drill-downs, cross-filtering, and cross-highlighting so users can move from main figure to child records.
Chat next to your numbers
Enable dashboard chat and ask follow-up questions about the same approved data and metrics that fuel the visualizations.
Share and present
Share a protected dashboard with signed-in colleagues or a public read-only link, or put it in presentation mode on an office TV or in the management meeting with one click.
One controlled data layer
Dashboards run on synchronized source data and reusable metrics. For example, AI, visualizations and automations work with the same definitions.
How it works
From business software to dashboard in three steps
No separate exports, connector code or report file per source. We do the linking work, you keep control over what is reported.
Link your data sources
For example, connect Exact Online, Twinfield or Simplicate. DigiData synchronizes the available tables into one controlled data layer.
Record definitions
Determine together what turnover, margin, active customer or project status means. Reusable metrics ensure that dashboards, AI and automations work on the same calculation.
Describe your dashboard
Ask the AI agent for an initial draft and refine it in conversation or with the visual editor. Add widgets, filters, drill-downs and a custom theme without starting a new development project.
Live demo
Click through a working dashboard yourself
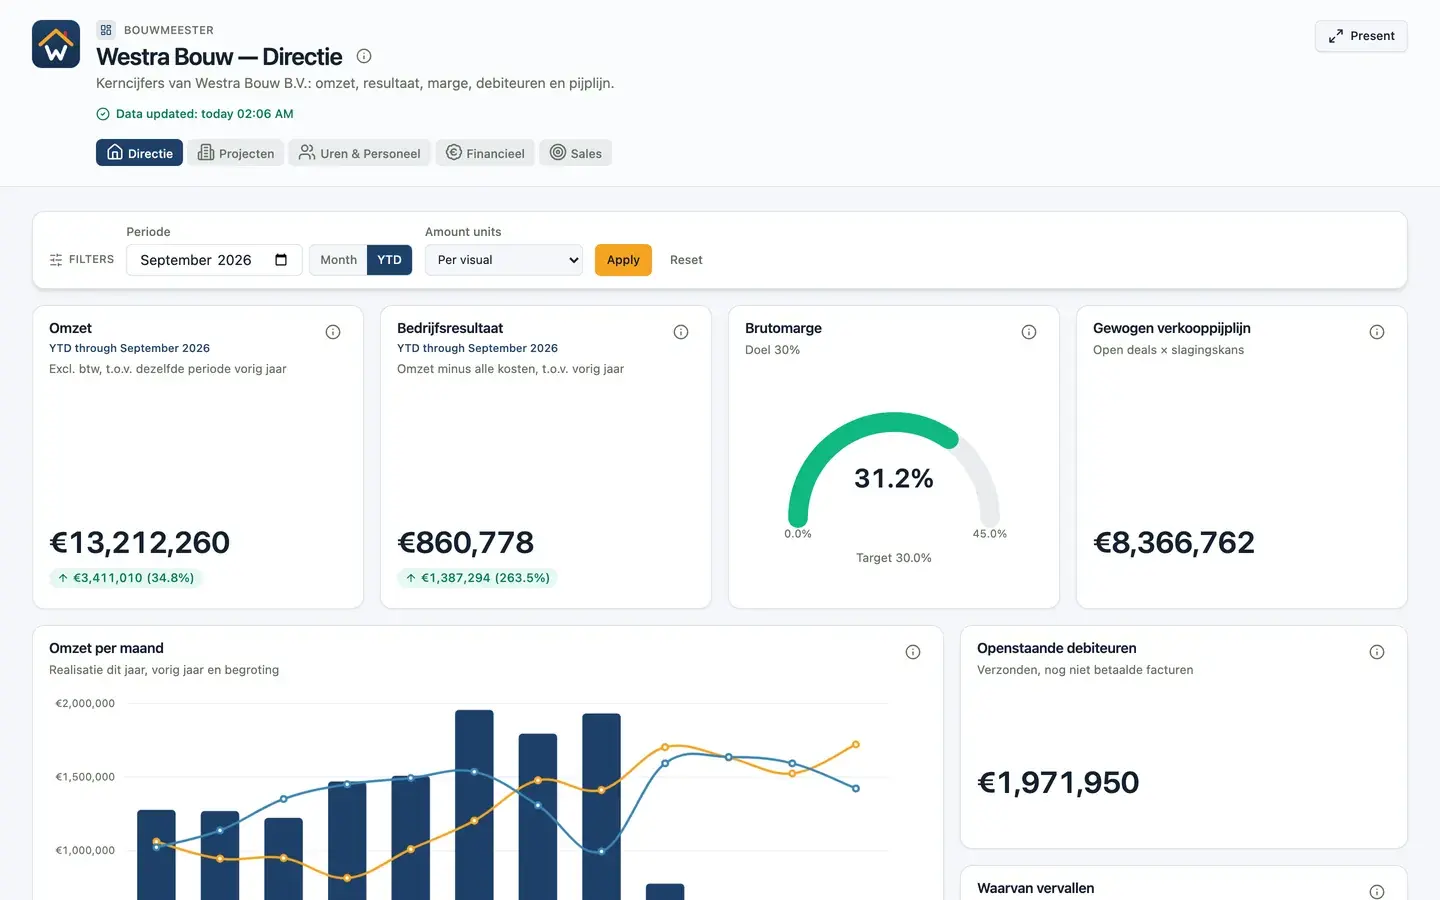
Westra Bouw is a fictional construction company with 50 employees. The demo report uses sample data shaped like Exact Online, Exact Bouw, Nmbrs and Pipedrive and has five pages: leadership, projects, hours, finance and sales. Filter by period, click a chart for details and start presentation mode. It is exactly what your colleagues or clients see.
37 seconds: from overview to presentation mode
The video shows the leadership dashboard with tooltips, then presentation mode stepping through every page on its own. Project pages repeat once per project category.
Presentation mode
From dashboard to TV screen or board meeting in one click
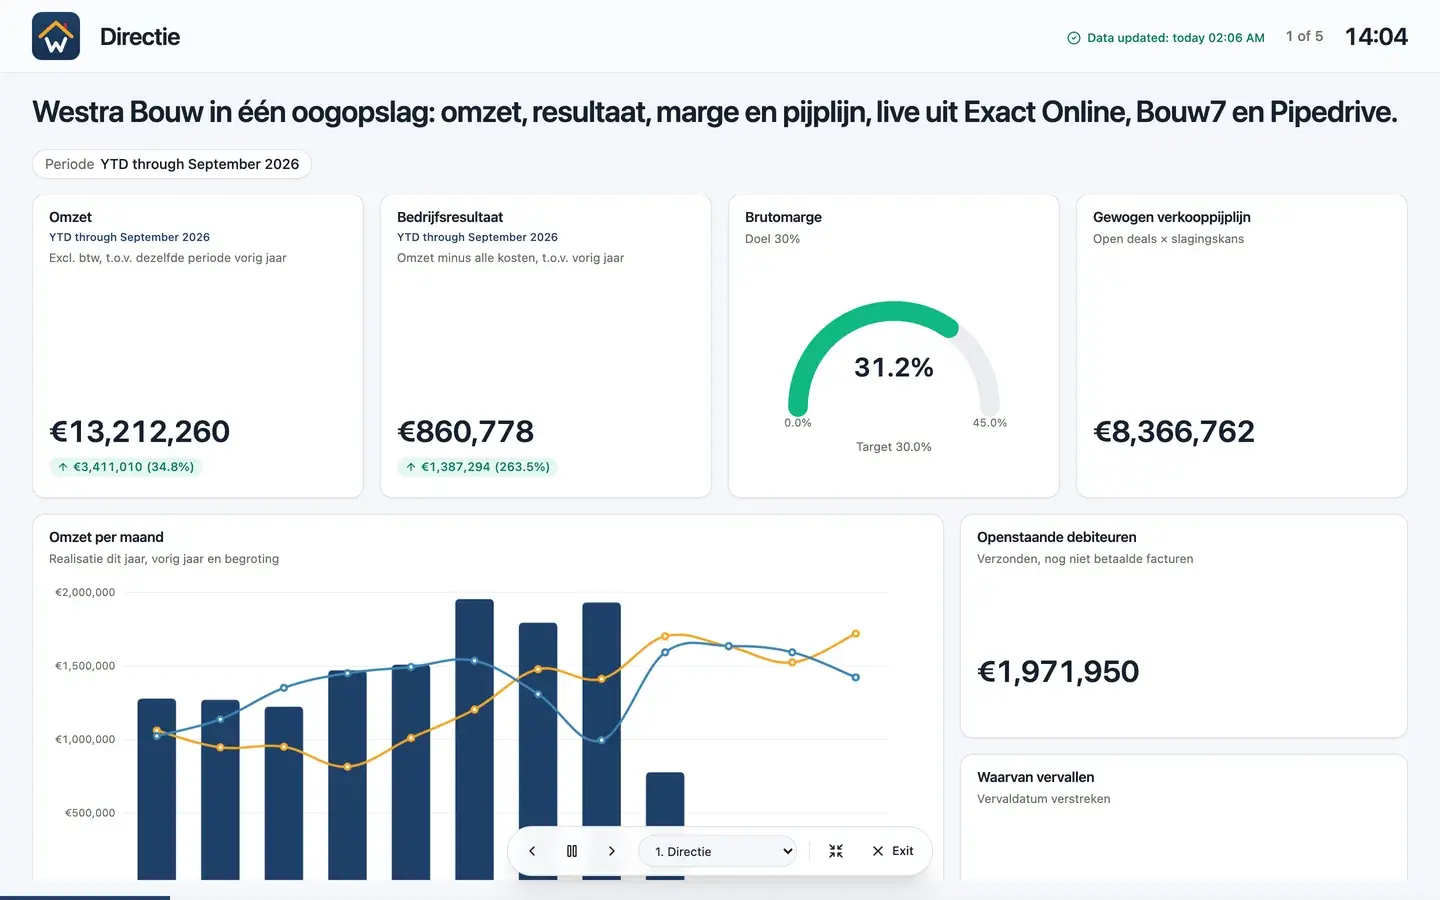
Every dashboard and report has a presentation mode. Put it on a screen in the workshop or canteen, or present it in the monthly management meeting. You do not need a separate slide tool or export.
- Ready-made presets for wall screens, meetings and spotlight
- Auto-advance with its own timing per page, loop forever or stop at the end
- Repeat a page per project, team or filter value, such as one slide per project category
- Control it with a keyboard or presentation clicker; it pauses when someone interacts
- Title bar with clock, progress and data freshness
- Fits every page to the screen without scroll bars
Power BI alternative
Is DigiData an alternative to Power BI?
DigiData can replace Power BI when a company especially need managed dashboards that are quick to build and simple can be used. The choice is less suitable if there is one at all large landscape of complex Power BI models and specialist self-service analyses are available.
| Element | DigiData dashboards | Power BI | Excel or separate exports |
|---|---|---|---|
| First dashboard | Build from a regular AI command and make visual adjustments. | Set up report, model and measures by a maker. | Collect files and shape them manually. |
| Data layer | Synchronized data sources and shared, approved metrics. | Own Power Query, model and DAX logic per solution. | Formulas and tabs in separate files. |
| AI use | AI helps build and answers questions based on the same definitions. | Depending on the chosen Microsoft environment and setup. | Not structurally linked to management and definitions. |
| Best choice for | Fast, managed dashboards for management and operations. | Complex BI, broad self-service and existing Microsoft models. | One-off check or small-scale ad-hoc analysis. |
Keep or replace Power BI?
You don't have to migrate everything at once. DigiData can keep feeding existing Power BI reports via OData while providing new, intuitive operational dashboards directly. Compare your options in detail: DigiData as a Power BI alternative for SMBs →
Dashboard + AI
One dashboard, different ways of seeing
A graph answers the well-known question. The built-in AI helps as soon as someone wants to know why a number changes or what detail needs attention.
- View the same approved KPIs in dashboard and chat.
- Filter by period, team, customer, project or other relevant dimensions.
- Go from a total to the underlying lines via drill-down.
- Adjust widgets and layout as information needs change.
Want to know more about the assistant behind the dashboard? See how the DigiData AI agent works with company data, measurements and access rights.
I have prepared a setup with three KPI's, a line graph and a regional bar graph. The period filter controls all visualizations.
Examples
Examples of custom dashboards
Start with the decisions a team needs to make, not a list of graphs. Open the dashboard examples to click through them live.
Financial dashboard
Revenue, costs, outstanding invoices and cash flow from your connected accounting software, with shared definitions across the team.
See the live example →Management dashboard
Turnover, margin, cash flow and progress in one compact overview for management or MT.
See the live example →Project dashboard
Budgeted and spent hours, project margin, planning, invoicing and work in progress per project.
See the live example →Sales dashboard
Pipeline, conversion, customer value, open quotes and performance per team or region.
See the live example →Operational dashboard
Current volumes, locations, occupancy, backlogs and exceptions on which a team must act immediately.
“We wanted our financial data and project hours in one place. DigiData takes care of this automatically, so that we can focus on designs instead of spreadsheets.”




Frequently asked questions
Frequently asked questions about custom dashboards
Please call: +31 6 15534337
What is a customized dashboard from DigiData?
A custom dashboard from DigiData is an interactive web view of your synchronized company data. It combines approved metrics, filters and visualizations into an overview for a specific role or method. You can set up the dashboard manually or ask the DigiData AI agent to create and customize it.
Can DigiData replace Power BI?
Yes, for companies that mainly need fixed management or operational dashboards, DigiData can be a simpler alternative to Power BI. You then do not need a separate Power BI report to view or maintain the dashboard. Power BI remains more suitable if your organization already uses many complex DAX models, broad self-service BI or in-depth Microsoft-specific reporting.
What makes the dashboards AI-native?
AI is not a separate chatbot next to the dashboard. The AI agent can build dashboards and widgets, uses the same approved metrics as the visualizations, and can answer questions about that data in the dashboard chat. A change therefore starts with a normal question instead of with technical report building work.
Do I need technical knowledge to create a dashboard?
Not for daily use. You describe which figures and breakdowns you want to see and can then visually adjust the result. For reliable reporting, data sources, definitions and access rights must be properly set up. DigiData helps set up that foundation.
Which data sources can I combine in a dashboard?
You can use the sources linked via DigiData, such as Exact Online, Twinfield, Simplicate, Exact Bouw, Robaws, Nmbrs and other supported integrations. Which tables are available can be found on the page of each integration.
Can I share a dashboard with customers or colleagues?
Yes. For internal dashboards, use the protected view for logged in users. There you can enable chat and controlled table or matrix export. You can also deliberately share a public, read-only link with your own theme and filters. Public dashboards do not reveal SQL or measure definitions. CSV export is a separate setting; disable it if anonymous visitors are not allowed to download the visible table or matrix data.
Can I show a dashboard on a TV screen or in a meeting?
Yes. Every dashboard and report has a presentation mode. Choose the wall screen, meeting or spotlight preset, set how long each page stays visible and let it loop on an office TV. In a meeting you step through pages with the keyboard or a presentation clicker. Pages can repeat per project, team or filter value.
How quickly can a custom dashboard be ready?
If the data sources and measurements have already been set up, the first version can be built directly from a normal description. The total lead time mainly depends on data quality, desired definitions, access rules and the number of data sources.
14 days free · no start-up costs